
.com 
fastruntime.com
A premium .COM for high-performance runtime environments, AI execution engines, low-latency inference, cloud infrastructure, distr…
ai
View listing
Home / Domains / runtimetrace.com
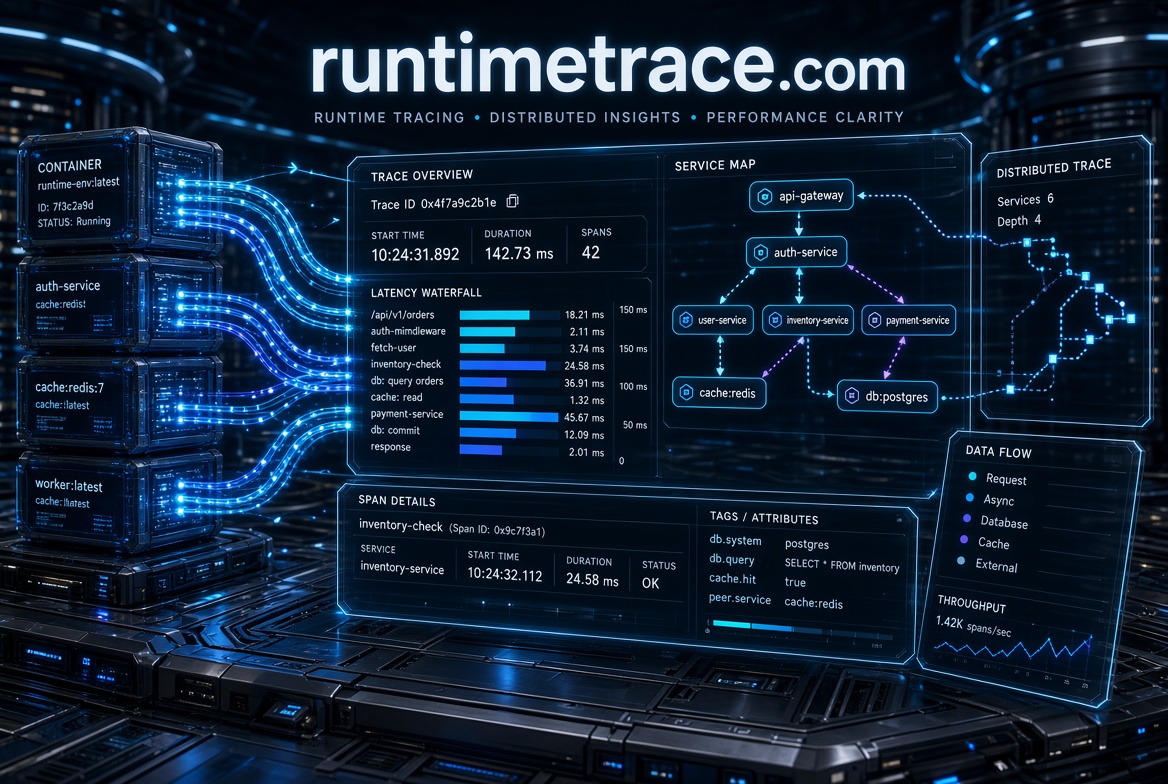
Runtime identifies software while it is actively executing. Trace suggests following events, reconstructing behavior, and discovering the path behind an outcome. Together, RuntimeTrace.com c
One message opens the conversation — availability, price, and how the transfer works.
Inquire on WhatsAppPrivate conversation. No account, no public bidding.
Prefer a form? Send a message
About this name
FOLLOW THE EXECUTION. FIND THE ANSWER.
Runtime identifies software while it is actively executing. Trace suggests following events, reconstructing behavior, and discovering the path behind an outcome. Together, RuntimeTrace.com creates a direct technical identity for tools that reveal what happened, where it happened, and why it matters inside running systems.
Modern applications can pass through services, queues, databases, APIs, and background workers before completing a single task. When something slows down or breaks, the problem is often hidden somewhere along that path. RuntimeTrace evokes a developer platform for reconstructing execution flows, connecting telemetry, inspecting dependencies, and turning scattered signals into a coherent explanation.
Follow requests across services and visualize how individual operations connect.
Examine timing, execution spans, and slow dependencies within application workflows.
Correlate errors with runtime events to narrow down potential causes of failures.
Bring logs, metrics, traces, and related metadata into one investigation workflow.
RuntimeTrace.com could anchor a distributed tracing platform, application performance monitoring product, runtime debugging tool, execution profiling service, developer diagnostics platform, microservices observability system, serverless tracing solution, AI agent execution trace viewer, software incident investigation toolkit, dependency analysis service, or telemetry correlation platform. The name brings together two familiar technical concepts—runtime behavior and execution tracing—in a concise, developer-oriented identity.
A natural positioning for developer tools that connect request spans across microservices, visualize latency, surface dependency bottlenecks, and simplify incident investigation.
An alternative direction for AI agent trace visualization, tool-call diagnostics, execution-step inspection, model latency analysis, and debugging across multi-stage automated workflows.
Also available
A premium .COM for high-performance runtime environments, AI execution engines, low-latency inference, cloud infrastructure, distr…
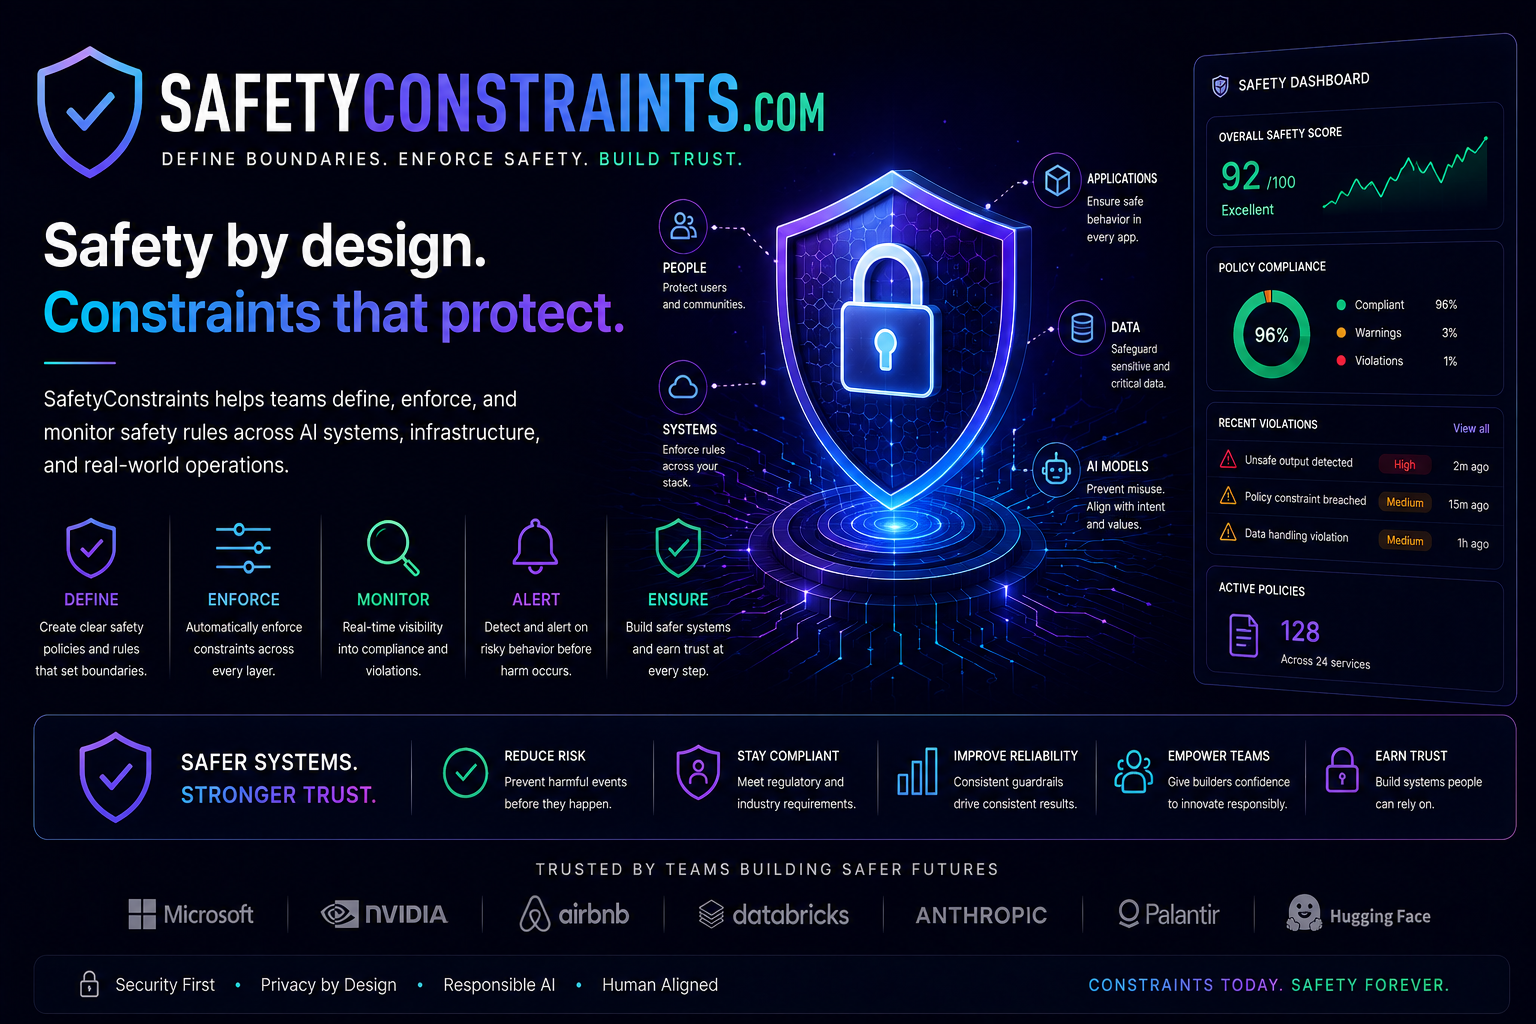
SafetyConstraints.com is a powerful, brandable domain for platforms that define, enforce, and continuously strengthen safety const…

FastSmartHome.com is a direct, memorable domain for smart-home platforms built around speed and simplicity — rapid installations…